- Mon 30 December 2024
- Public
- marci
- #Reversing, #FPGA
So I was experimenting with FPGA softcores and was wanting to debug the MicroBlaze core. I used a Xilinx Spartan 6 board from Digilent (Nexys 3) and found the built in Xilinx ISE debugger very basic. I then researched that the XMD server (Xilinx Microprocessor Debugger) actually serves as a GDB backend. Connecting with GDB was possible using:
- Open Xilinx SDK
- Debug > Launch XMD
connect mb mdm -cable type digilent_plugin- Start GDB:
C:\Xilinx\14.7\ISE_DS\EDK\gnu\microblaze\nt\bin\mb-gdb.exe -q -nw --cd=C:\Users\admin\workspace\softcore_demo --command=.gdbinit C:\Users\admin\workspace\softcore_demo\Debug\softcore_demo.elf target remote :1234
Since I wanted a better experience on the Windows 7 VM I was using, I searched online for debugger tools and was very happy about finding Lauterbach's T32. I use it for work and at first I did not like it very much, however I started to LOVE it recently.
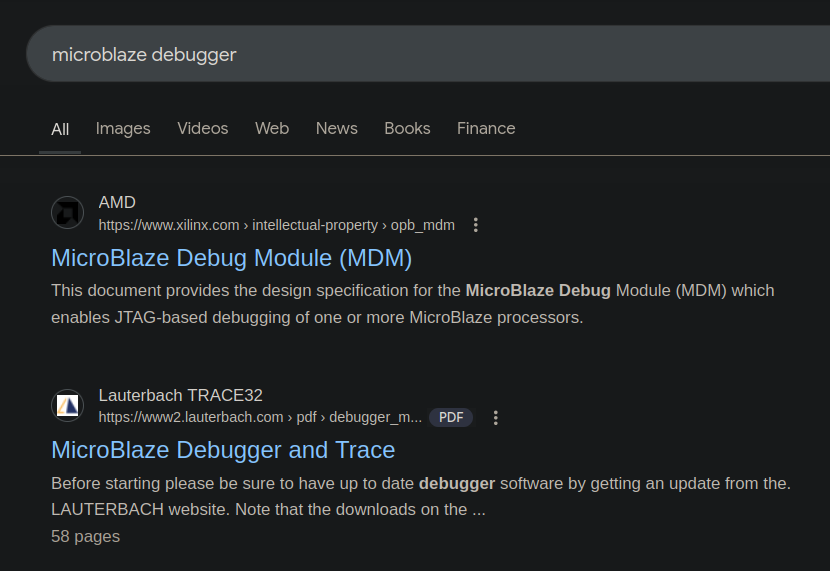
I read up on it and found out that T32 can actually act as a GDB backend and also frontend too. Which means connecting to XMD should be very easy. However, this document explains that here is no MicroBlaze support:
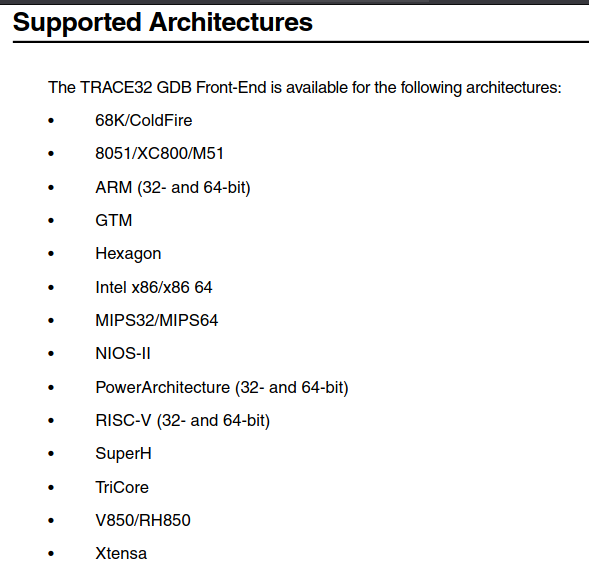
However, I really wanted to try this out, so I found a torrent for the PowerPC (demo) version. I think there are open-source PPC softcores, so in the future I should check those out.
Also, if we are talking about torrents, the full cracked version of Xilinx ISE is Xilinx.ISE.Design.Suite.v14.7.ISO_TBE, I can not give magnet links sadly, because I found it on a private tracker (nCore). The Linux version of it can be downloaded from AMD after a (non-working) registration page, but I also found a cool guy who mirrors it. I used a Windows 7 VM, because there is a bug in the File Picker (see this eevblog forum post) which will crash ISE in Windows 10. There is also a fixed version for Windows 10 from AMD, however I wanted the cracked version, so that is why i went with Windows 7 (cracking was still done on a Windows 10 VM though).
So after obtaining the PPC version of T32, we could get to cracking :^)
Loading up the 14 MB executable in Ghidra takes a lot of time and a lot of RAM. (I needed to add an extra 10 GBs of swap because the OOM killer shut my entire desktop environment down.)
There are a lot of string references for "license", the exe is 32-bit and contains everything needed for the program to run. Also, the addresses will be the same for every launch which makes it painless to debug. After a few hours of static reversing I managed to find that it uses RLM (Reprise License Manager) which does not seem to be protected in any way (?) and also has open documentation with function names, status codes and parameters (!!!).
The actual licensing is pretty complex, there are a plethora of ways to get a license: using the debug cable (or head? - hardware unlock), using a centralised server with a floating license, static license and/or maintenence keys (which are like upgrade keys). These can be all valid for a specific product (like the supported architecture) and a specific version. I did not want to understand all of this, I just wanted the 10-minute demo mode to dissappear.
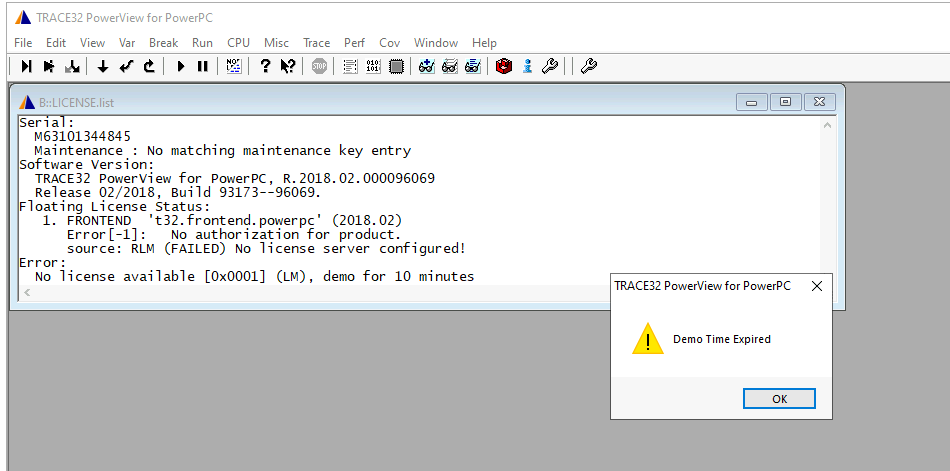
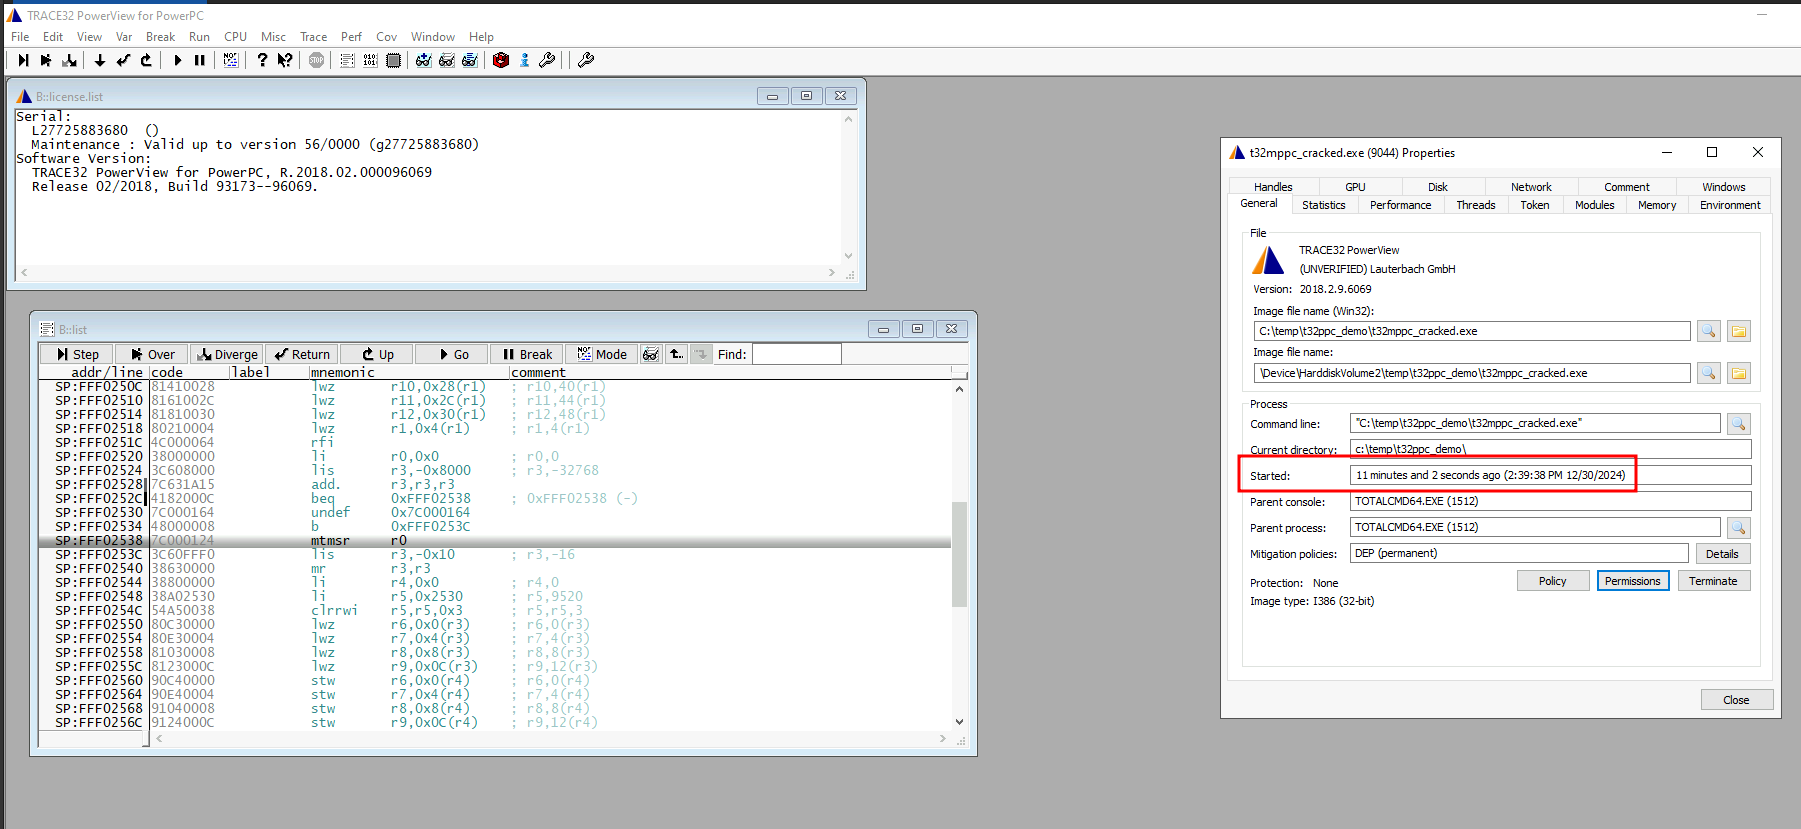
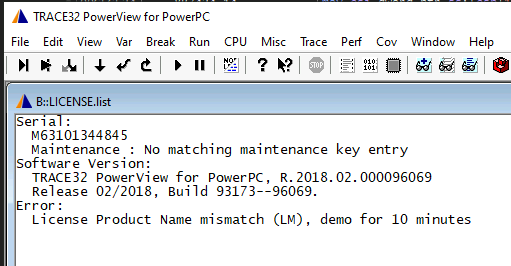
But how can I test this? Upon starting T32 we can check the license with the command license.list: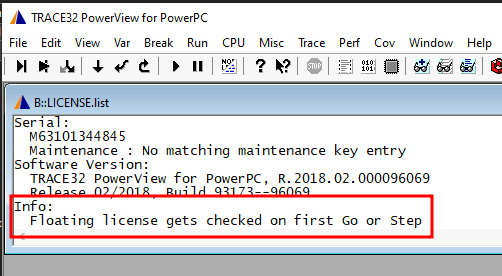 .
.
Oops, we need to "Go" or "Step" T32, however we can not do that until we have established a debug session. Luckily it is very easy, we just need a PowerPC GDB session. Using QEMU we can launch one: qemu-system-ppc -M mac99 -cpu G4 -S -gdb tcp::12345 -device VGA,romfile=/home/marci/Downloads/vgabios-stdvga.bin -nographic. (QEMU would not launch without that vgabios file, I just downloaded one from the web, I dont even think it is the same architecture though, but it does not matter since we are halting the core right after startup.) After that, the license check can be triggered using:
SYStem.PORT 192.168.1.100:12345system.attachstep
After that we get the following:
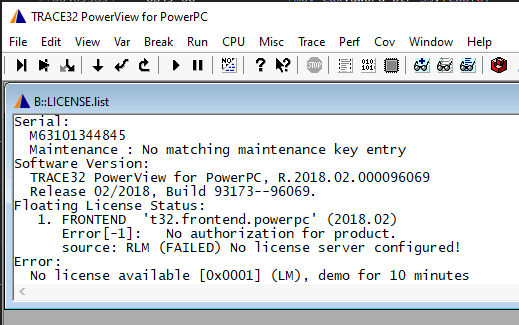
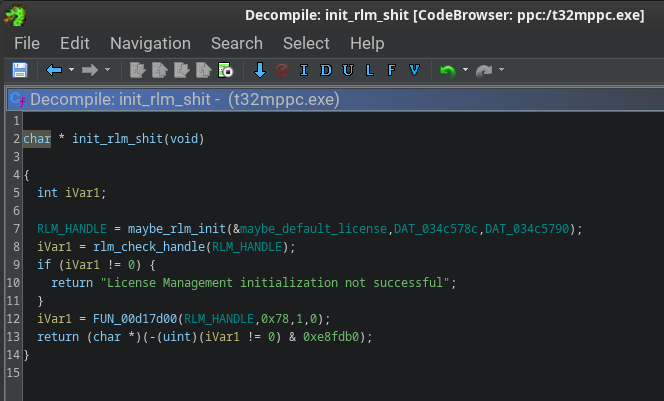
After placing a breakpoint on the init_rlm_shit() we can check the stacktrace and identify what calls it out of the two Ghidra found: 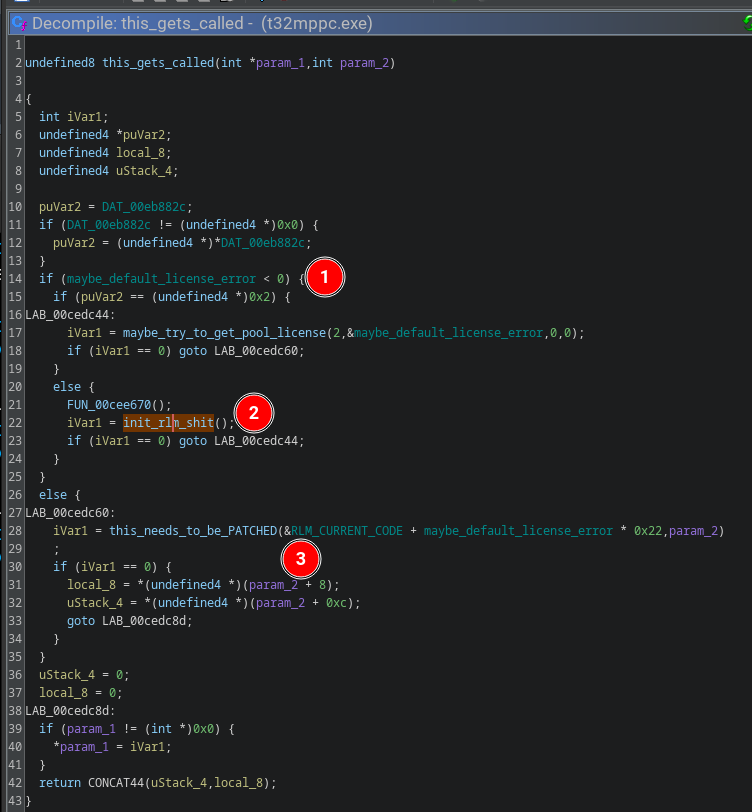
maybe_default_license_error (@ 0x011a0004) contains an init value for the RLM_CURRENT_CODE variable I think, because it equals to 0xffffffff (= -1) which is exactly matches with the RLM_EL_NOPRODUCT status code we are getting in the GUI (No authorization for product).
After chaning this to all zeroes using x64dbg we will get a different error: 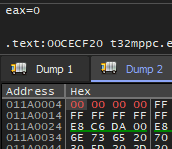
We can see that the "Floating License Status" error went away, we now get a very weird Product Name mismatch error. This is because of this function: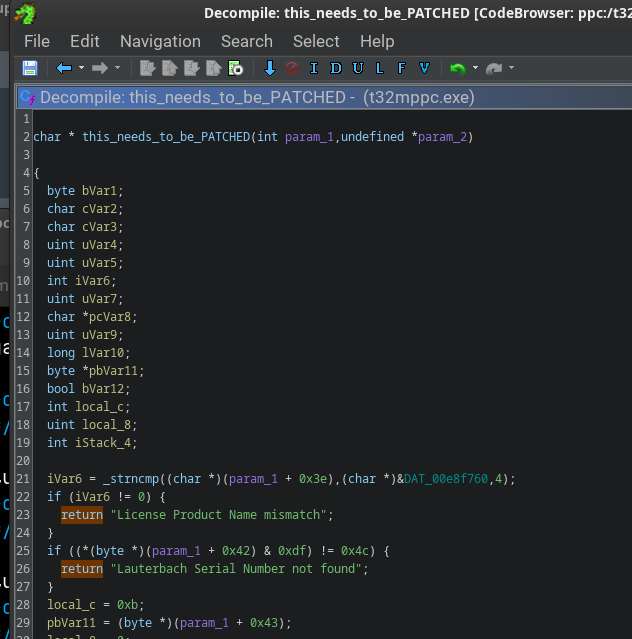 .
.
We can just patch this all out with returning a null-pointer.
Before: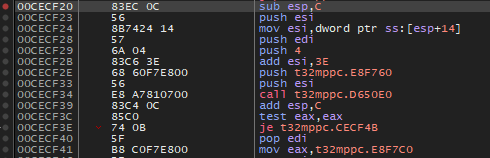
After: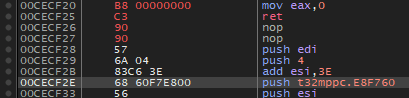
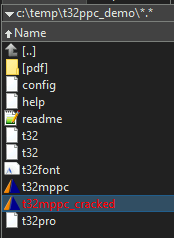
After that we can generate a patched EXE: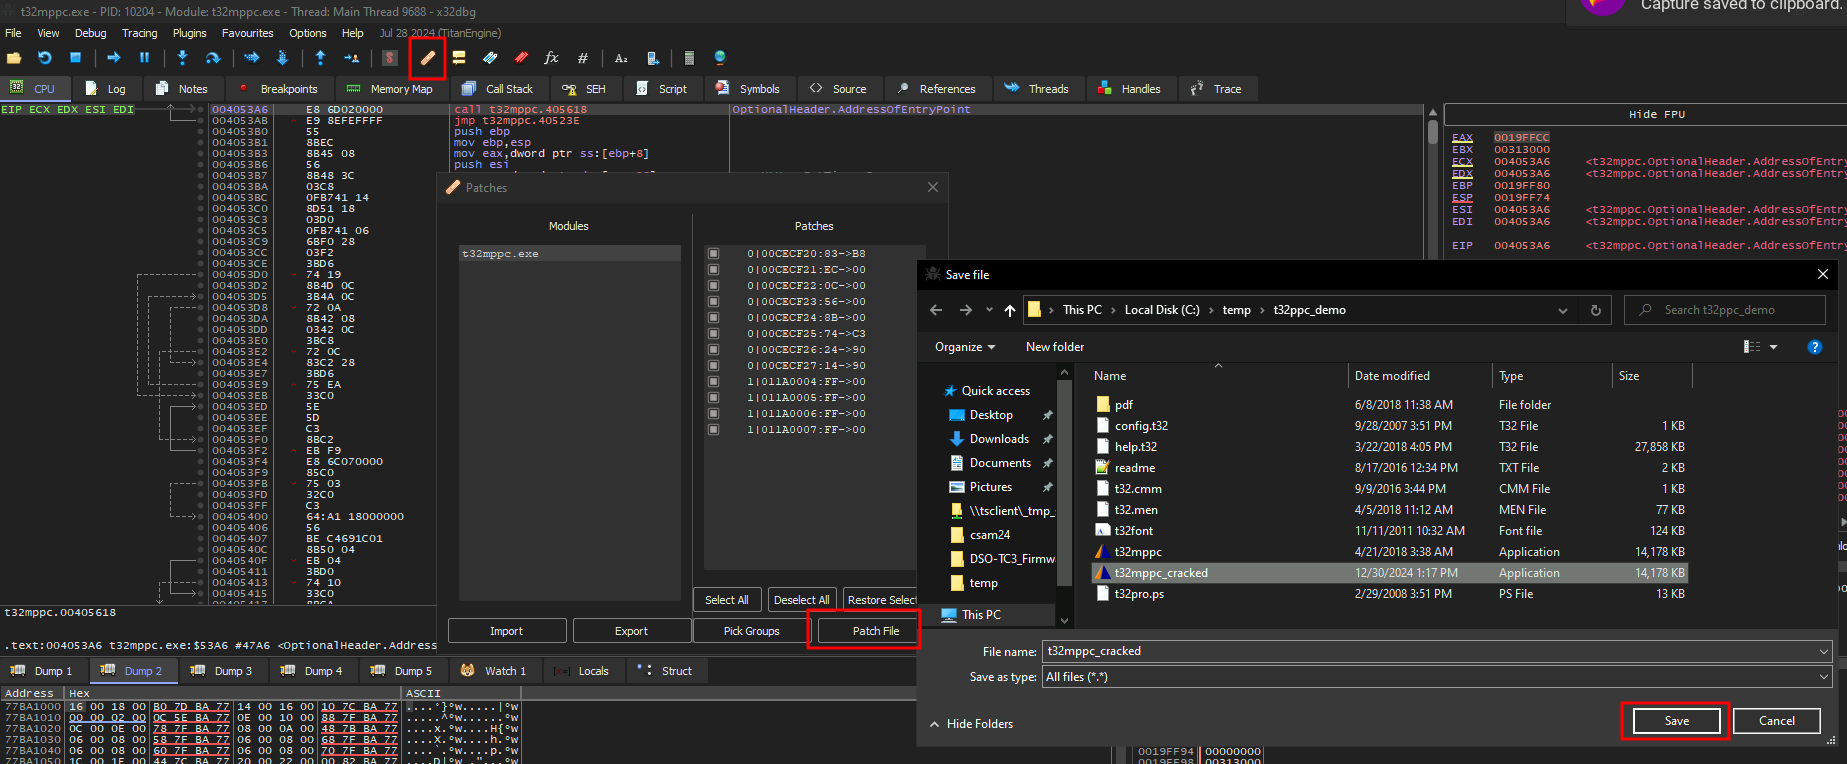
10 minutes after launch, we can see that we are still running, so this was enough to crack it :)